ProFlex® is designed to optimize your time, ignite your investment IQ, and maximize your financial potential.
Proflex Nov 9–13 — Liquidation Thursday, Fund Blowups, Chips on Sale
Published about 7 hours ago • 13 min read
Proflex Market Update — Week Nov 9-13, 2026
Liquidation Thursday | The Funds That Broke | The Sweep That Lit It | Chips on Sale
"Thursday was not a verdict on AI. Leveraged funds sold what they had to, not what they wanted to. Prices broke. The order books did not." — Proflex Panel
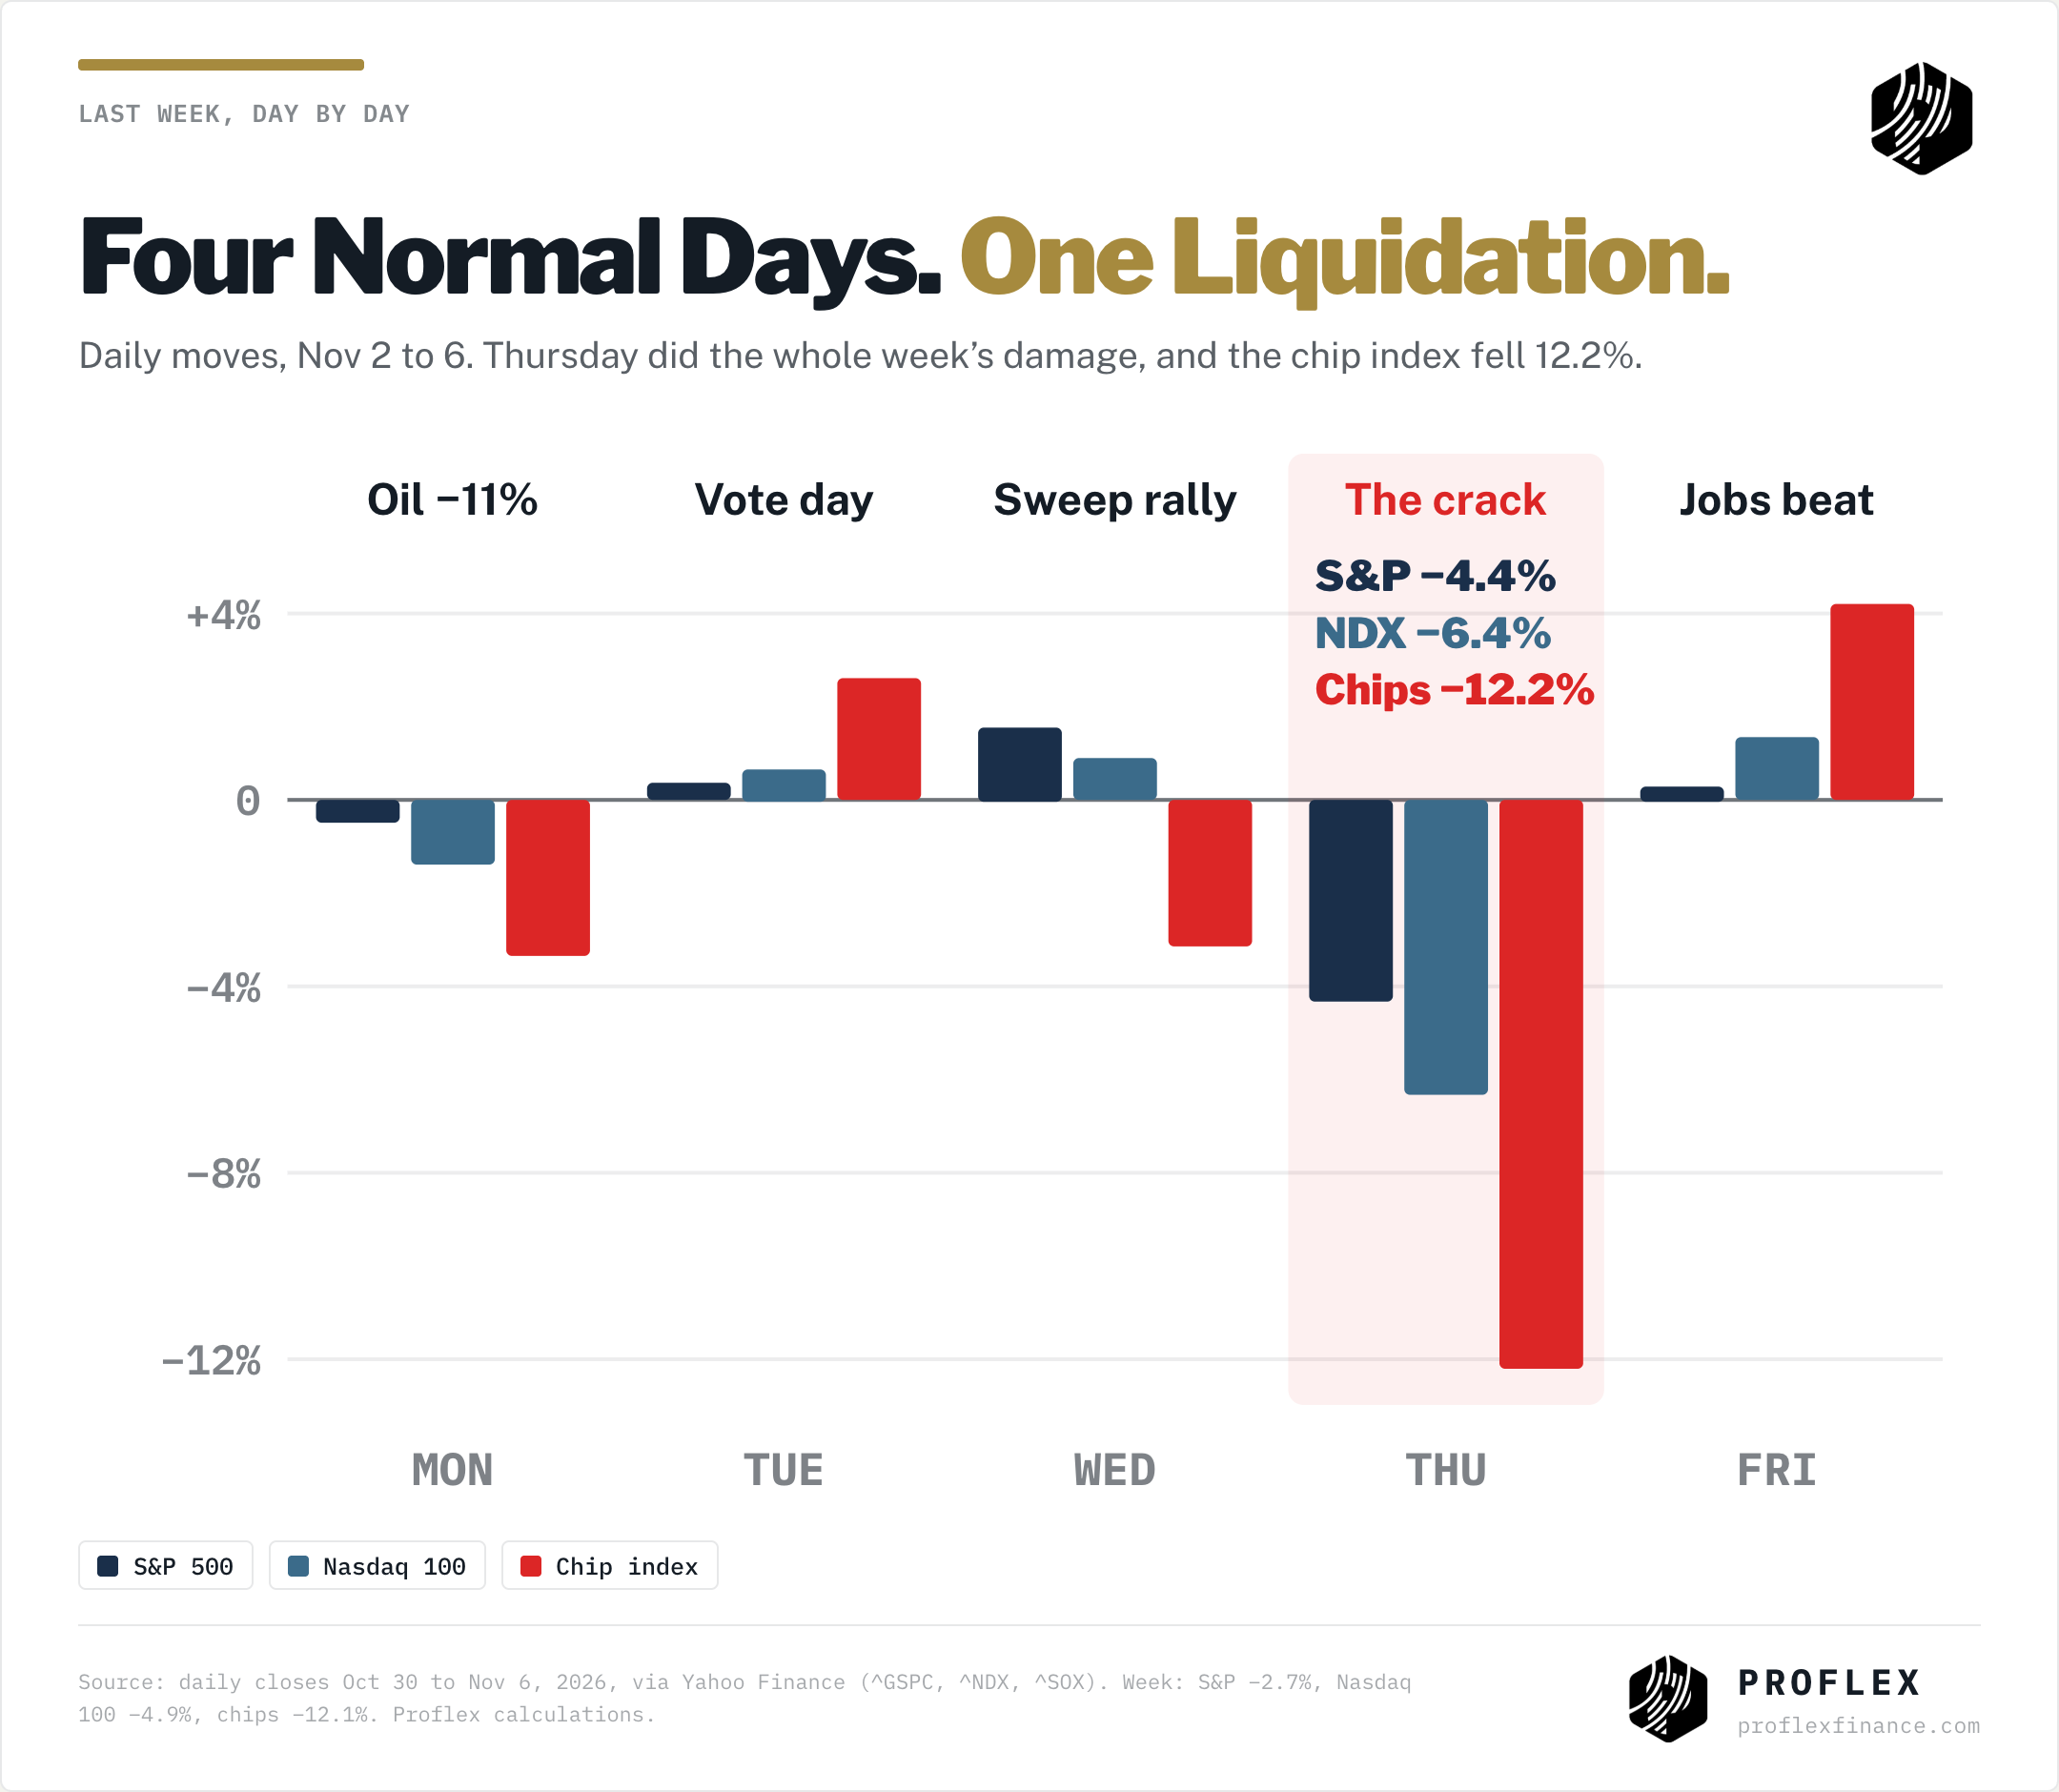
The week in 30 seconds ▸ On Thursday, November 5, the Nasdaq 100 fell 6.4%, its worst day since March 2020. The chip index fell 12.2% and the 3x chip ETF (SOXL) 38.7%. ▸ Leveraged ETFs had to sell an estimated $47 billion to $57 billion of stock into the close. Junk bonds moved 0.3%. ▸ The volume was almost all sell side. The only two exact matches since 2011 were both the bottom. VIX jumped 69.7%, and after 40%+ spikes SPY was higher a month later 81% of the time. ▸ Democrats took both chambers of Congress, and top Democrats called for a national data centre moratorium. That lit the fuse. Leverage did the rest. ▸ Brent fell 16.4% to $98.32, its biggest weekly drop since April 2020. Gold rose 4.5%. ▸ This week: CPI on Tuesday, CoreWeave the same night, Nvidia on November 17.
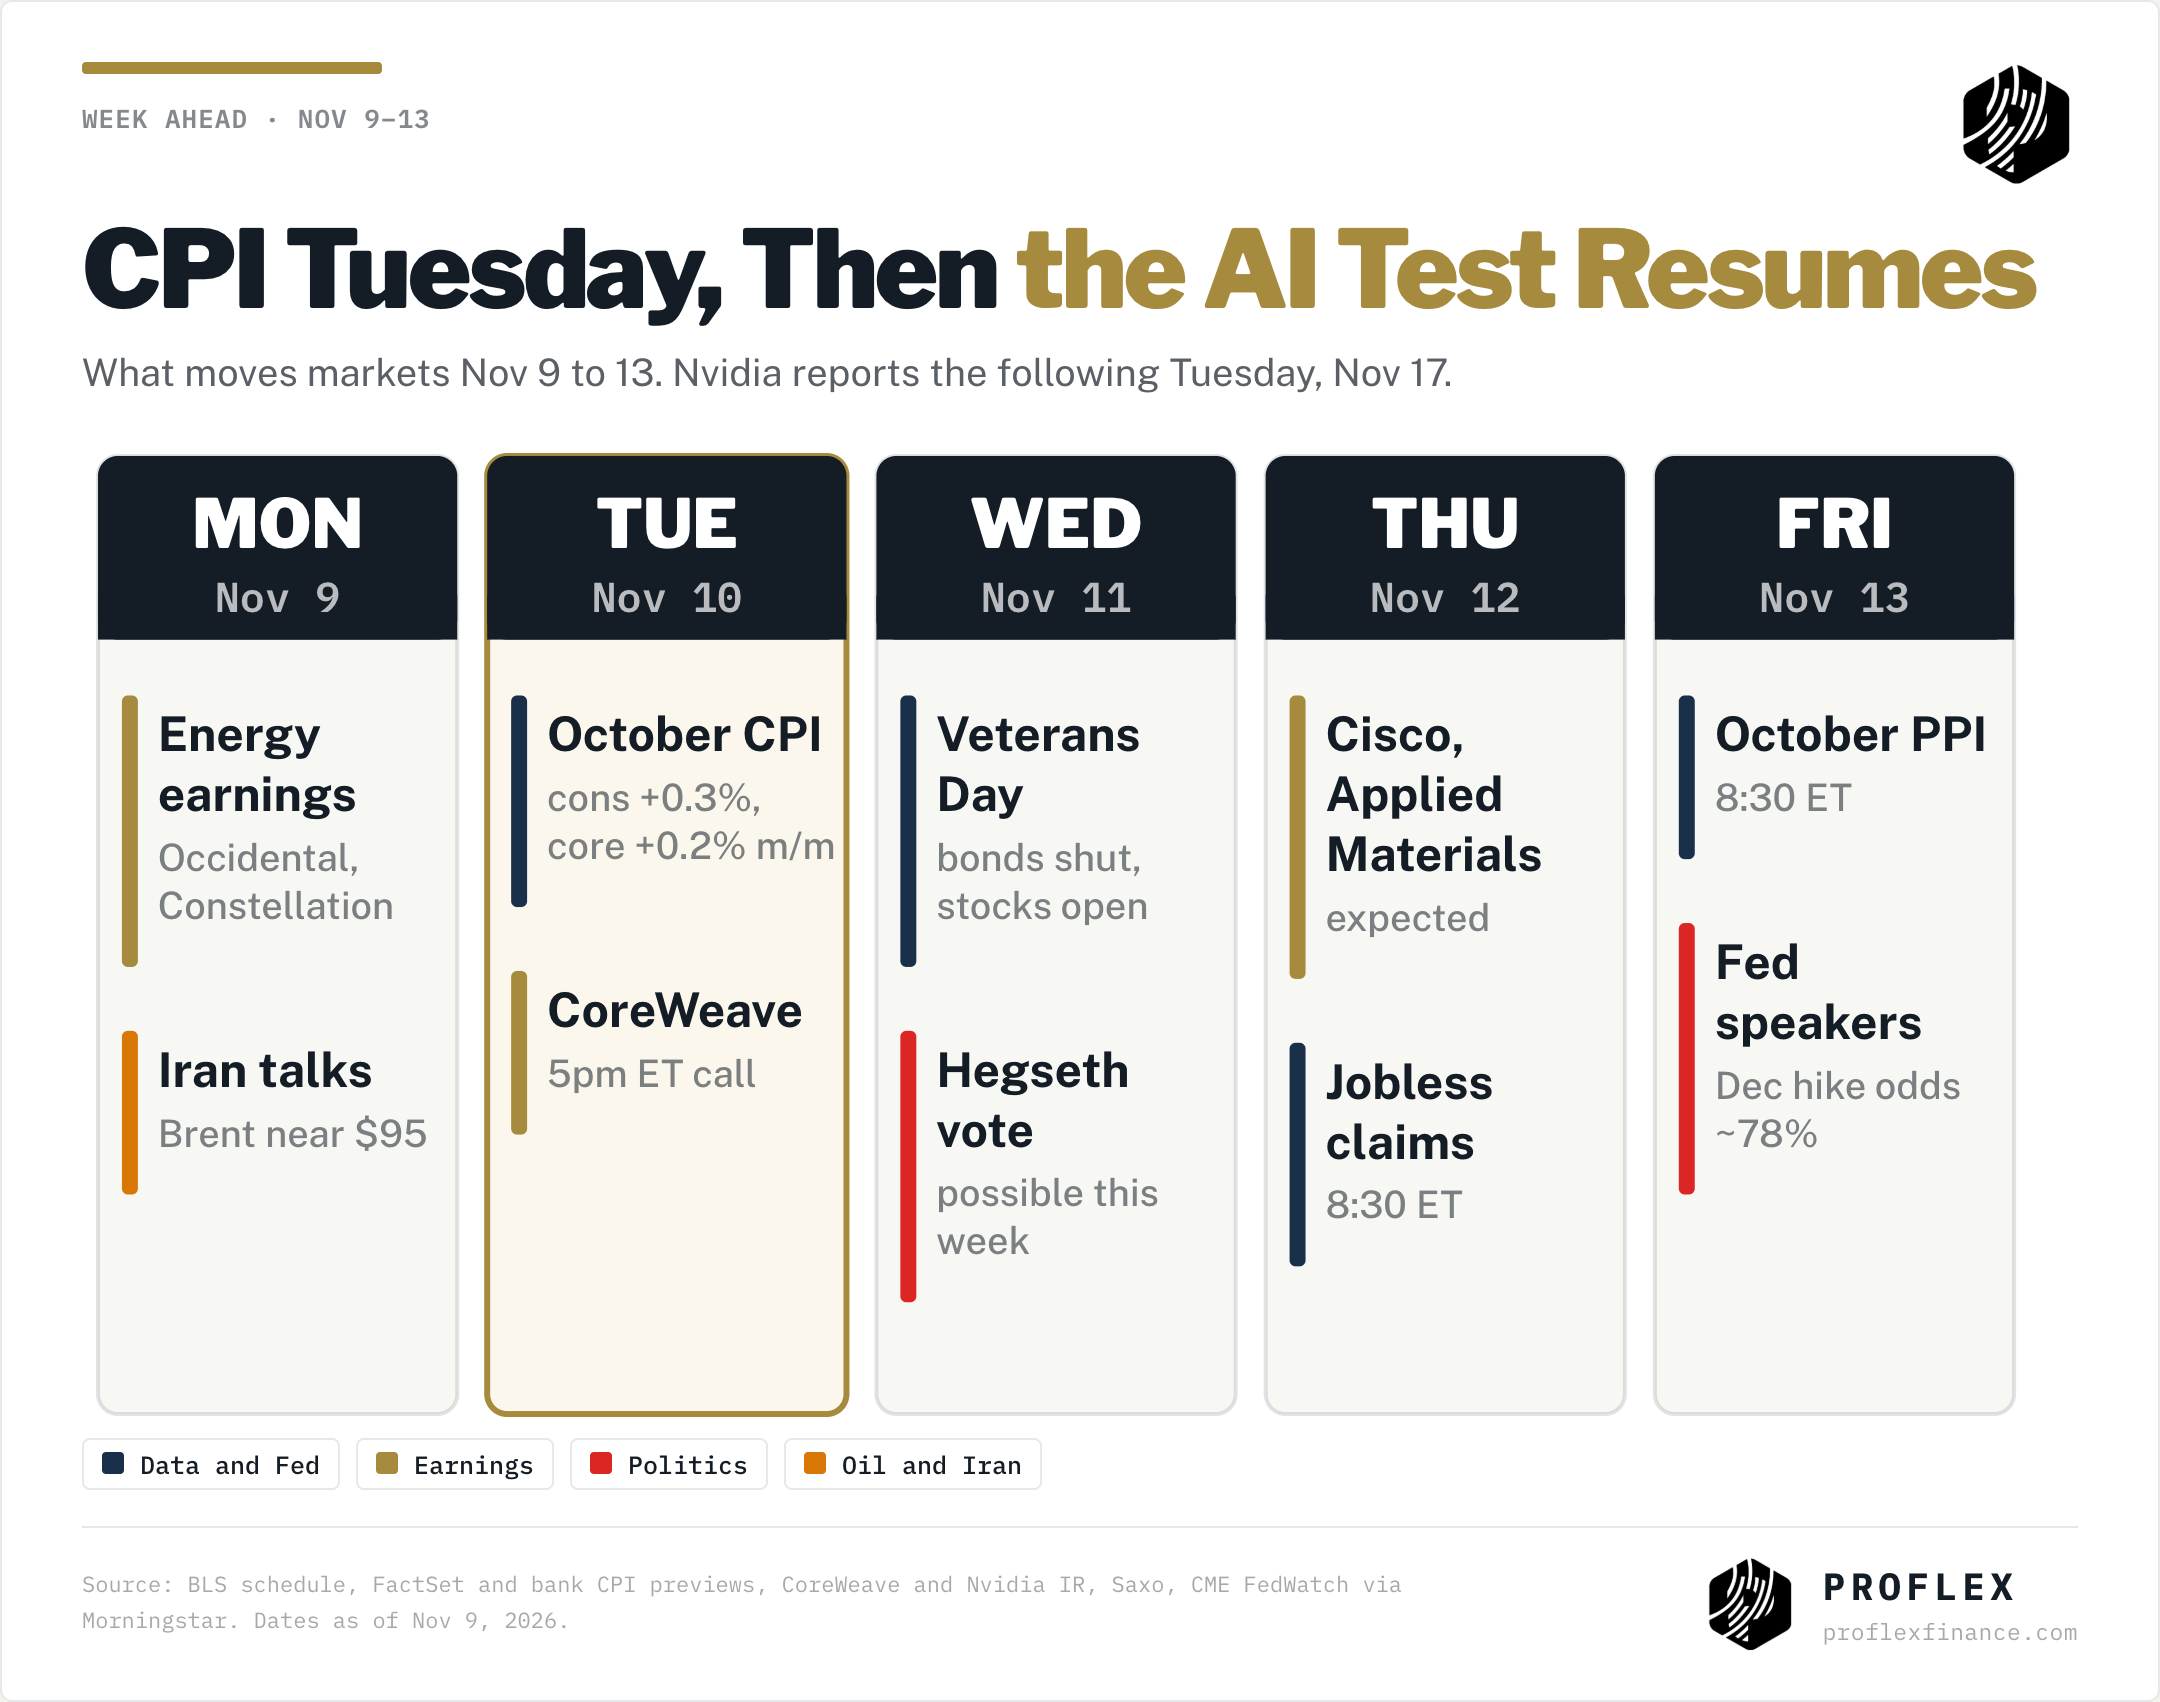
The S&P 500 fell 2.7% last week to 7,376.86, its worst week since April 2025, and the Nasdaq 100 fell 4.9% to 26,989.99. Almost all of it happened in one session. The VIX closed Thursday at 28.18 and ended the week at 25.64, while the 10 year yield slipped to 4.86%. There was no macro call this week, so this edition is the Proflex desk’s own read. Here is the week ahead first.
Key Drivers This Week
What Actually Happened on Thursday?
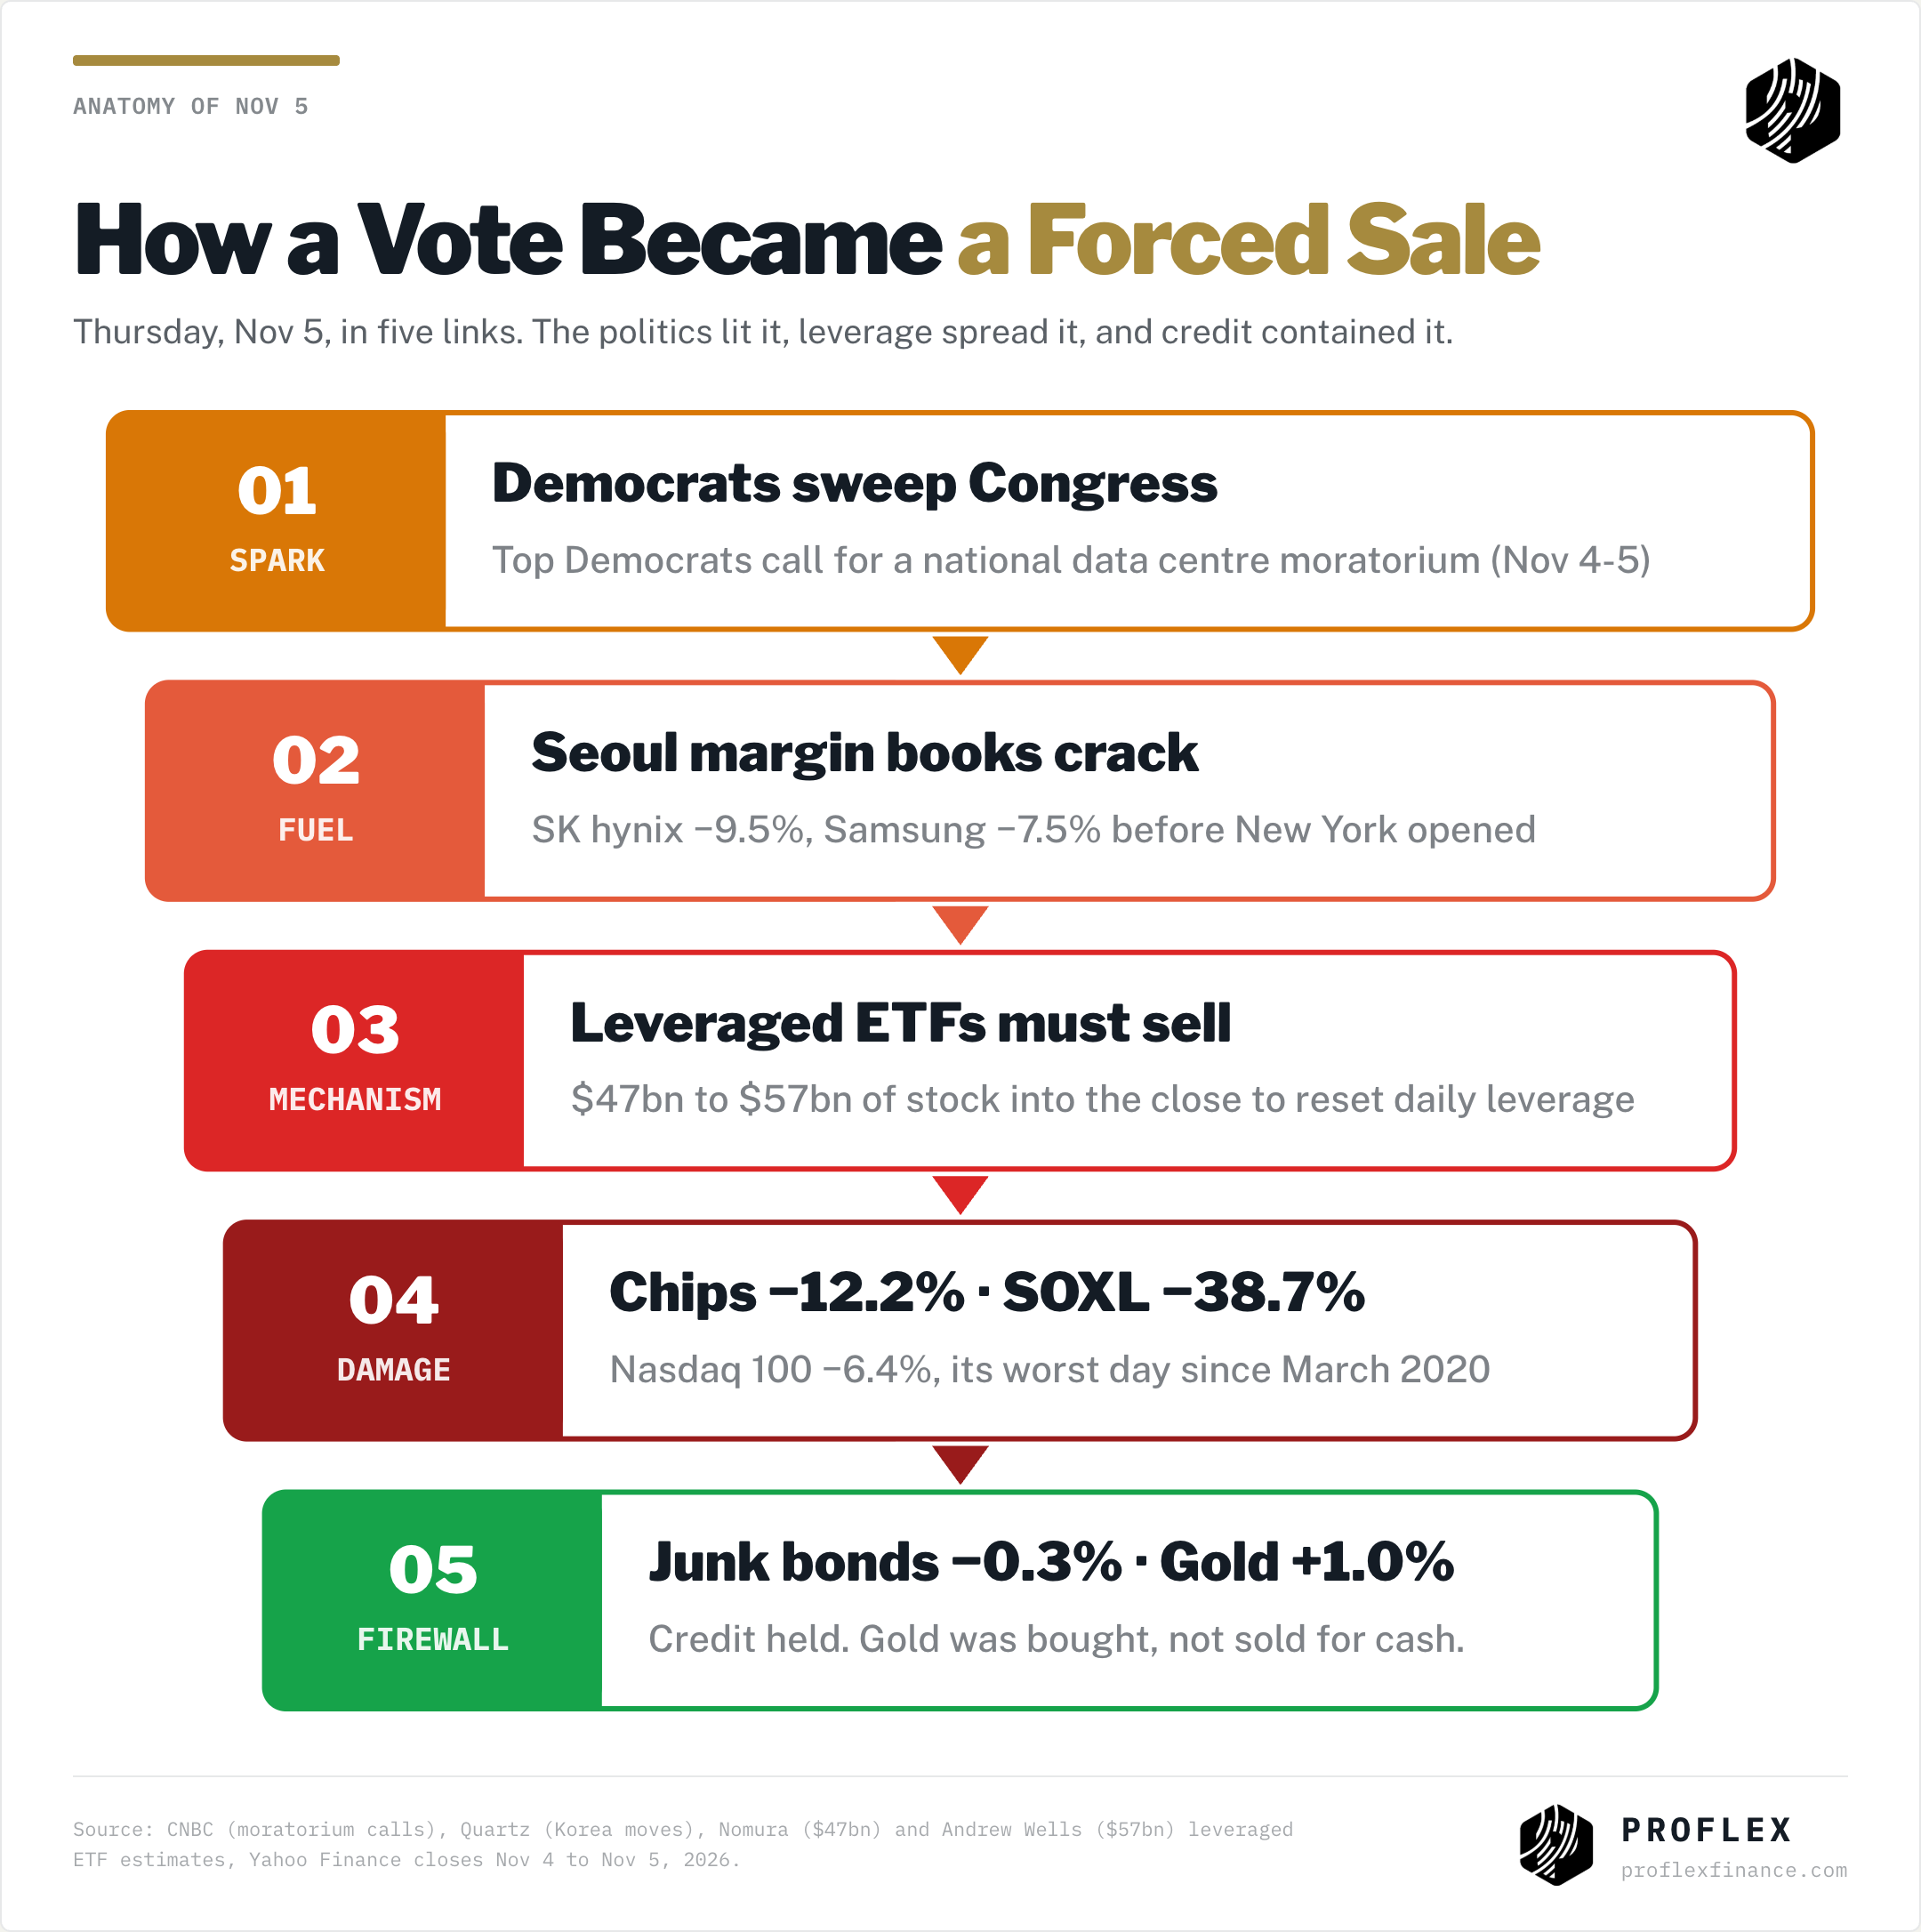
A forced sale. Leveraged ETFs promise two or three times the daily move of an index, so after a big down day they have to sell to bring their exposure back in line. On Thursday that bill came to about $47 billion by Nomura’s estimate, the second largest in its data, and about $57 billion by another estimate, the most since 2007. That selling lands in the last minutes of trading, whatever the news.
The volume tells the same story. SOXL traded 4.7 times its 20 day average volume on Thursday, and QQQ, Nvidia, AMD and Micron each traded about 3 times. The S&P 500 as a whole traded only 1.4 times normal, and the high yield bond ETF HYG fell just 0.3%. That is what a liquidation signature looks like: heavy, concentrated selling in the most crowded and most leveraged names, while the wider market and credit barely flinch.
Has the Market Seen a Day Like This Before?
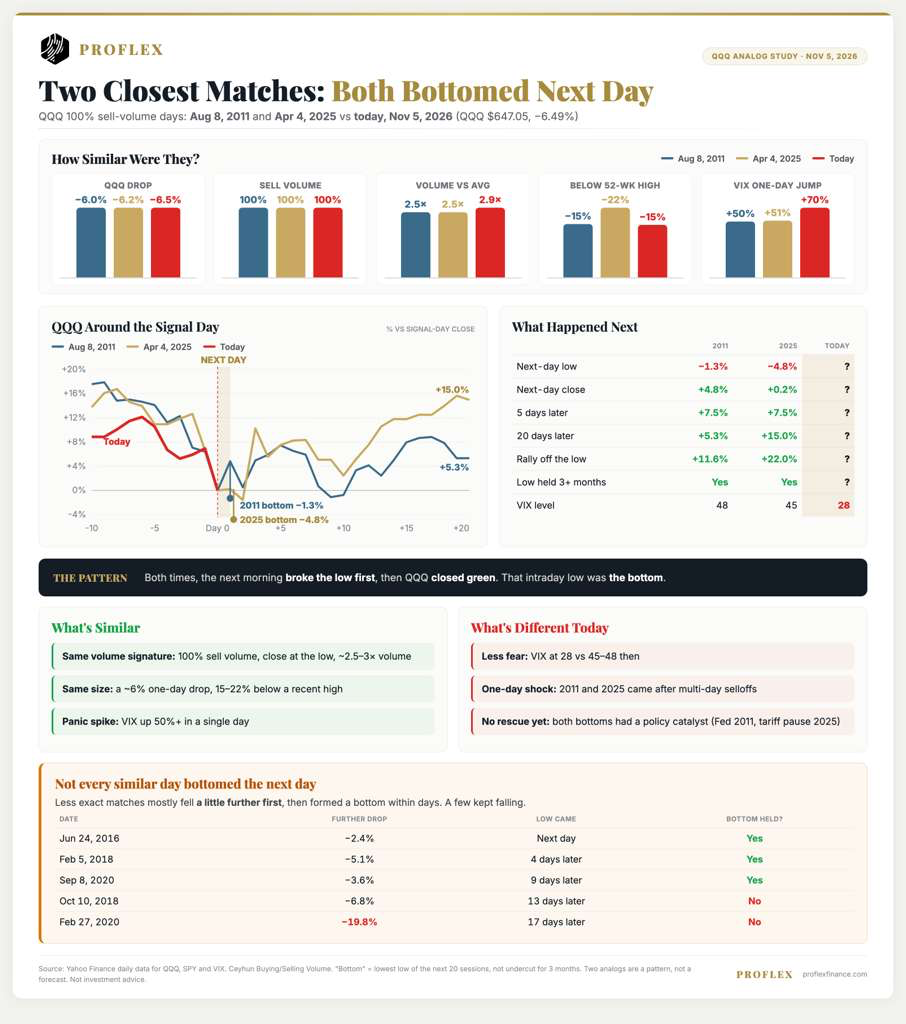
Twice, and both times it marked the bottom. Our own study looked for days when QQQ volume was close to 100% sell side, the index closed at its low on two to three times normal volume, and VIX jumped more than 50%. That is a liquidation signature: nobody choosing to sell, everybody having to. Two days in the last fifteen years match Thursday almost exactly: August 8, 2011, the US debt downgrade, and April 4, 2025, the tariff selloff. QQQ closed Thursday at $647.05, down 6.49%, right on its low.
How to read it: the top row shows how alike the three days were, with a 6% drop, 100% sell volume, about 2.5 to 3 times normal volume and a VIX jump of 50% or more. The line chart tracks QQQ around each signal day. In 2011 and 2025 the next morning broke the low one more time, then QQQ closed green, and that intraday low held for more than three months. Twenty days later QQQ was up 5.3% in 2011 and 15.0% in 2025.
The less exact matches, shown at the bottom, mostly fell a little further first, 2% to 7%, and found their floor within two weeks. Two did not hold: October 2018 and February 2020, the start of COVID, when the real damage was still ahead. And there are honest differences this time. Fear is lower, with VIX at 28 against 45 to 48 back then. This was a one day shock rather than the end of a long slide. And no policy rescue has arrived yet, unlike the Fed in 2011 or the tariff pause in 2025.
So far Friday has tracked the playbook in spirit, if not in detail. QQQ never revisited Thursday’s low (Friday’s low was $653.99) and closed 1.4% higher. The level that matters now is $647.05. As long as Thursday’s close holds, the signal is intact.
Is a VIX Spike a Buying Opportunity?
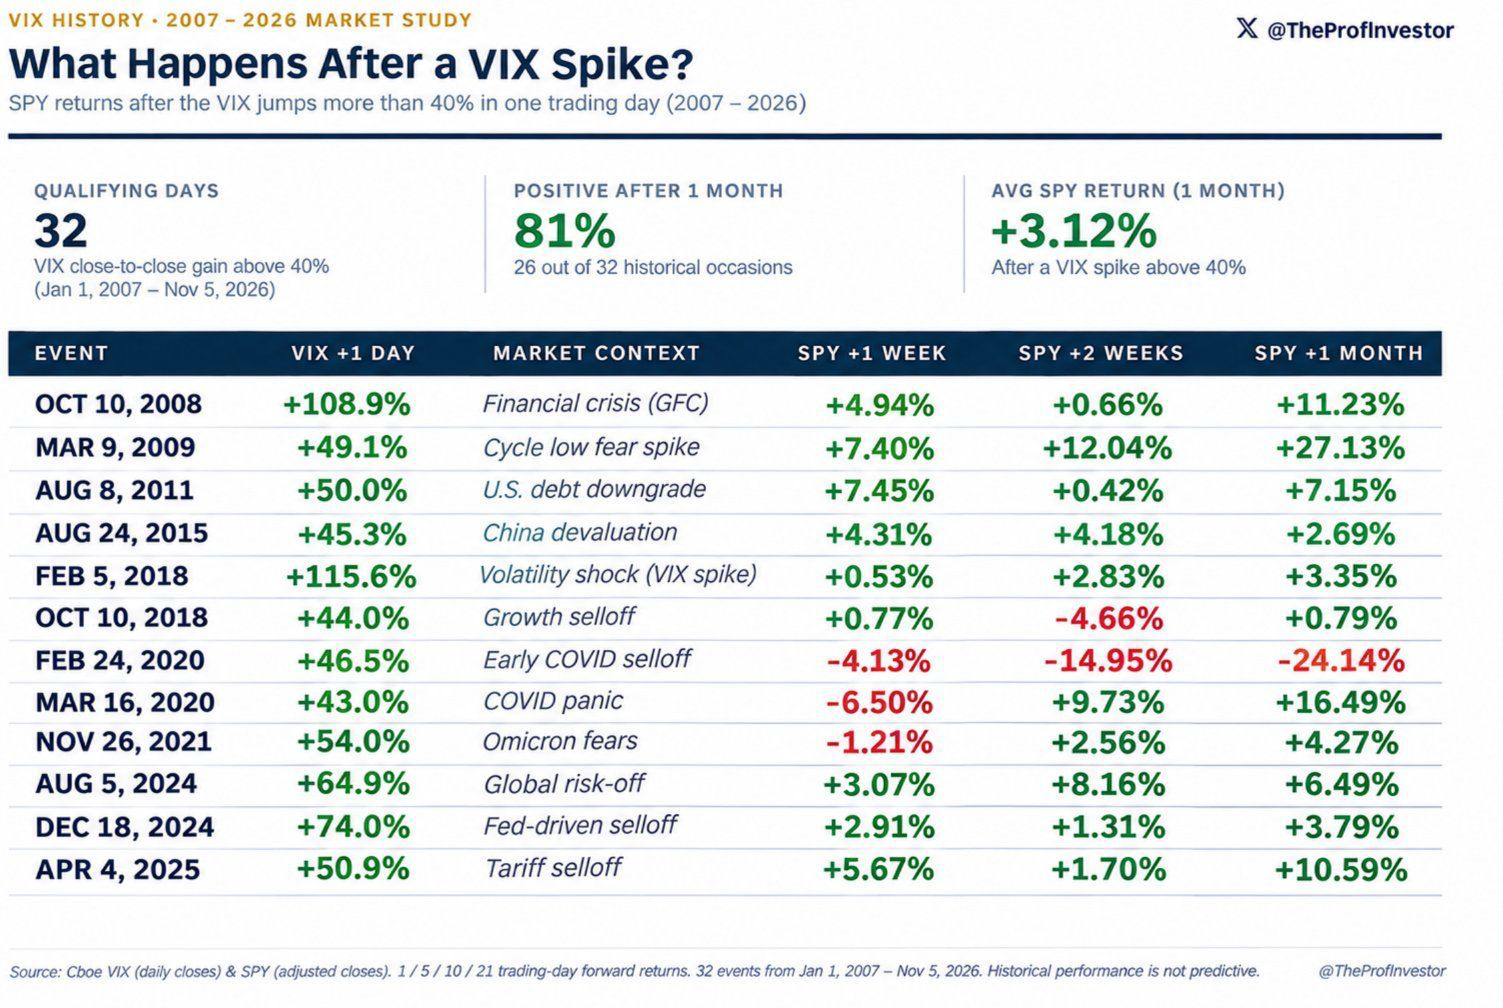
Usually, yes. VIX, the market’s fear gauge, jumped 69.7% on Thursday, from 16.61 to 28.18. Since 2007 there have been 32 days when VIX rose more than 40% in a single session. One month later the S&P 500 (SPY) was higher 26 times out of 32, or 81%, with an average gain of 3.12%.
How to read it: each row is a day the fear gauge exploded, with what SPY did one week, two weeks and one month later. The pattern is that panic peaks fast and fades fast. The debt downgrade in 2011, the yen carry unwind in August 2024 and the tariff shock in April 2025 were all higher a month later, by 7.2%, 6.5% and 10.6%. The exception that matters is February 2020, when the spike was the start of a crisis rather than the end of a squeeze, and SPY fell another 24%. Chart: @TheProfInvestor, using Cboe and SPY data.
Elevated fear is a cost for traders and an opportunity for owners. A high VIX means options are expensive and buyers are scarce, which is exactly when long term investors get paid to step in. VIX had already eased to about 23.5 by Monday morning.
Proflex View: A liquidation signature is not a forecast, and two analogs are a pattern, not a promise. But the odds sit with the buyer here: forced sellers are done, fear has spiked, and history says that combination usually rewards patience. Our line is simple. Above $647.05 on QQQ, we add in steps. A clean break below it means the de-grossing has another leg, and we slow down rather than give up.
Then the sellers ran out. On Friday AMD rose 11.0%, TSMC 6.3% and SOXL 12.5%, with no new information about any of those businesses. Prices that move 17% down and 11% up in two sessions are being set by the mechanics of leverage, not by investors changing their view.
Proflex View:Last week we wrote that the selling looks forced. Thursday proved it. Call it what it is: a price set by leverage rules, not by investors. That is about as close to a manufactured move as markets get, and manufactured moves tend to reverse once the forced sellers are done.
Which Hedge Funds Broke, and Is the De-Grossing Over?
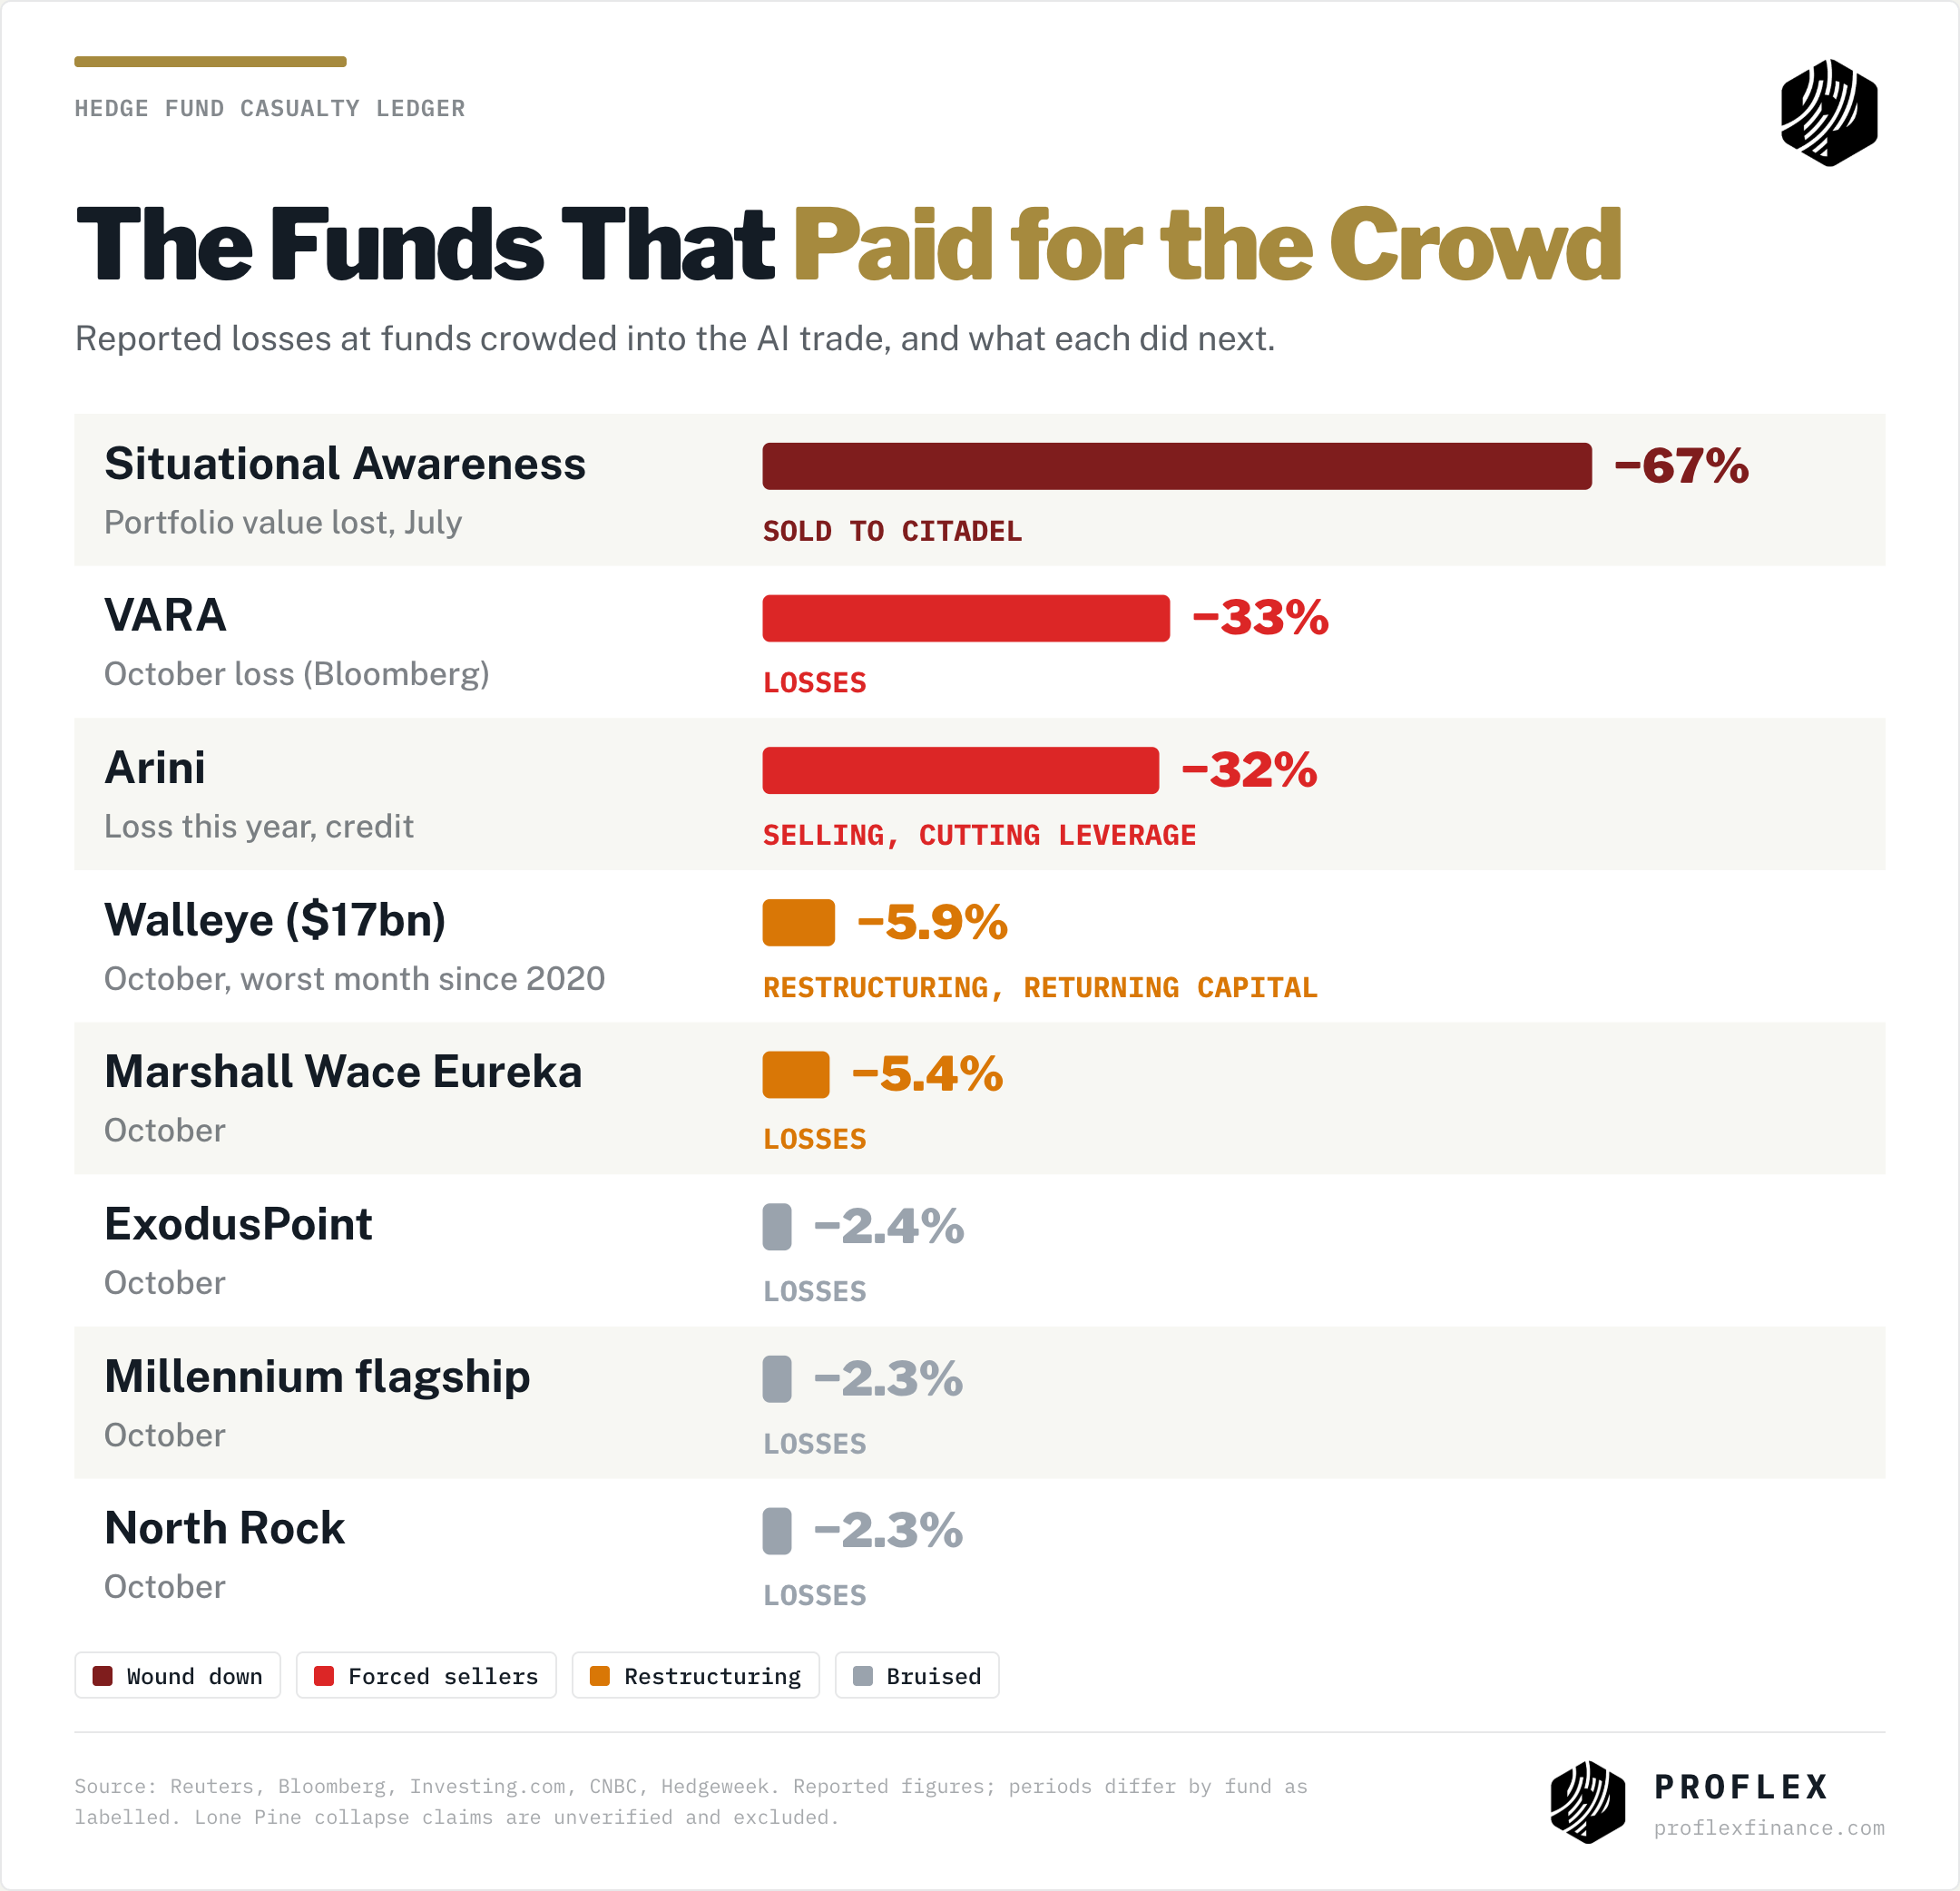
The selling had names behind it. Walleye Capital, a $17 billion multi-strategy firm, lost 5.9% in October, its worst month since March 2020, and is restructuring its stock picking unit and returning capital to investors (Reuters). Credit specialist Arini is down 32% this year and is selling positions to cut leverage (Bloomberg). VARA lost about a third in October, Engineers Gate and Samlyn cut staff, and even the giants bled: Marshall Wace Eureka −5.4%, ExodusPoint −2.4%, Millennium −2.3% in October. Social media claims that Lone Pine collapsed have not been verified, so we leave them out.
Goldman Sachs’ prime book shows the scale. Hedge funds sold technology stocks at the fastest pace in at least a decade, about $20 billion in two weeks, close to the $23 billion of the July unwind, and net leverage fell 4.2 points to 73.4% in October. RBC’s Andrzej Skiba called it "a massive hedge fund capitulation" in AI related debt. One caution: tech is still 23.5% of Goldman’s prime book, so the de-grossing may have further to run.
Proflex View:In late July we wrote that the fundamentals did not break, the leverage did. The same thing happened again, only bigger. De-grossing ends when the weakest holders are gone, and a $17 billion fund handing money back to investors is what the late stage of that process looks like. We would not call the exact low, but the forced sellers are now a smaller share of the market than they were a month ago.
Did the Midterms Cause the Crash?
They lit it. Democrats took the Senate, about 54 to 44 with two races still open, and the House, about 254 to 162 with roughly 19 uncalled (AP). Stocks rallied 1.6% on Wednesday once President Trump said he would accept the result. Within 24 hours the mood flipped. Top Democrats called for a national data centre moratorium, Texas Governor-elect Gina Hinojosa campaigned on a state one, and in Seoul SK hynix fell 9.5% and Samsung 7.5% before New York opened (CNBC, Quartz). Trump blamed the result for the selloff.
The election made the crash probable, not inevitable. Funds were already crowded into the same AI winners, and Korean retail investors had piled record margin debt into two chip stocks. A data centre headline was the match, and leverage was the dry wood. The new majority is not sworn in until January, the Sanders and Ocasio-Cortez moratorium bill has sat in Congress since March, and analysts doubt any law could meaningfully stall construction. What it does bring is hearings and investigations. A House vote on impeaching Defense Secretary Pete Hegseth over the Iran war could come as soon as this week.
Proflex View:Last week we wrote that the election itself matters less than what it does to oil. We got the channel wrong, and we are saying so: the vote hit stocks through AI politics, not oil. But a moratorium that is a headline rather than a law does not change what the hyperscalers have already contracted to spend. Policy noise is a reason to size carefully, not a reason to sell the build out.
Is Tech Cheap After the Selloff?
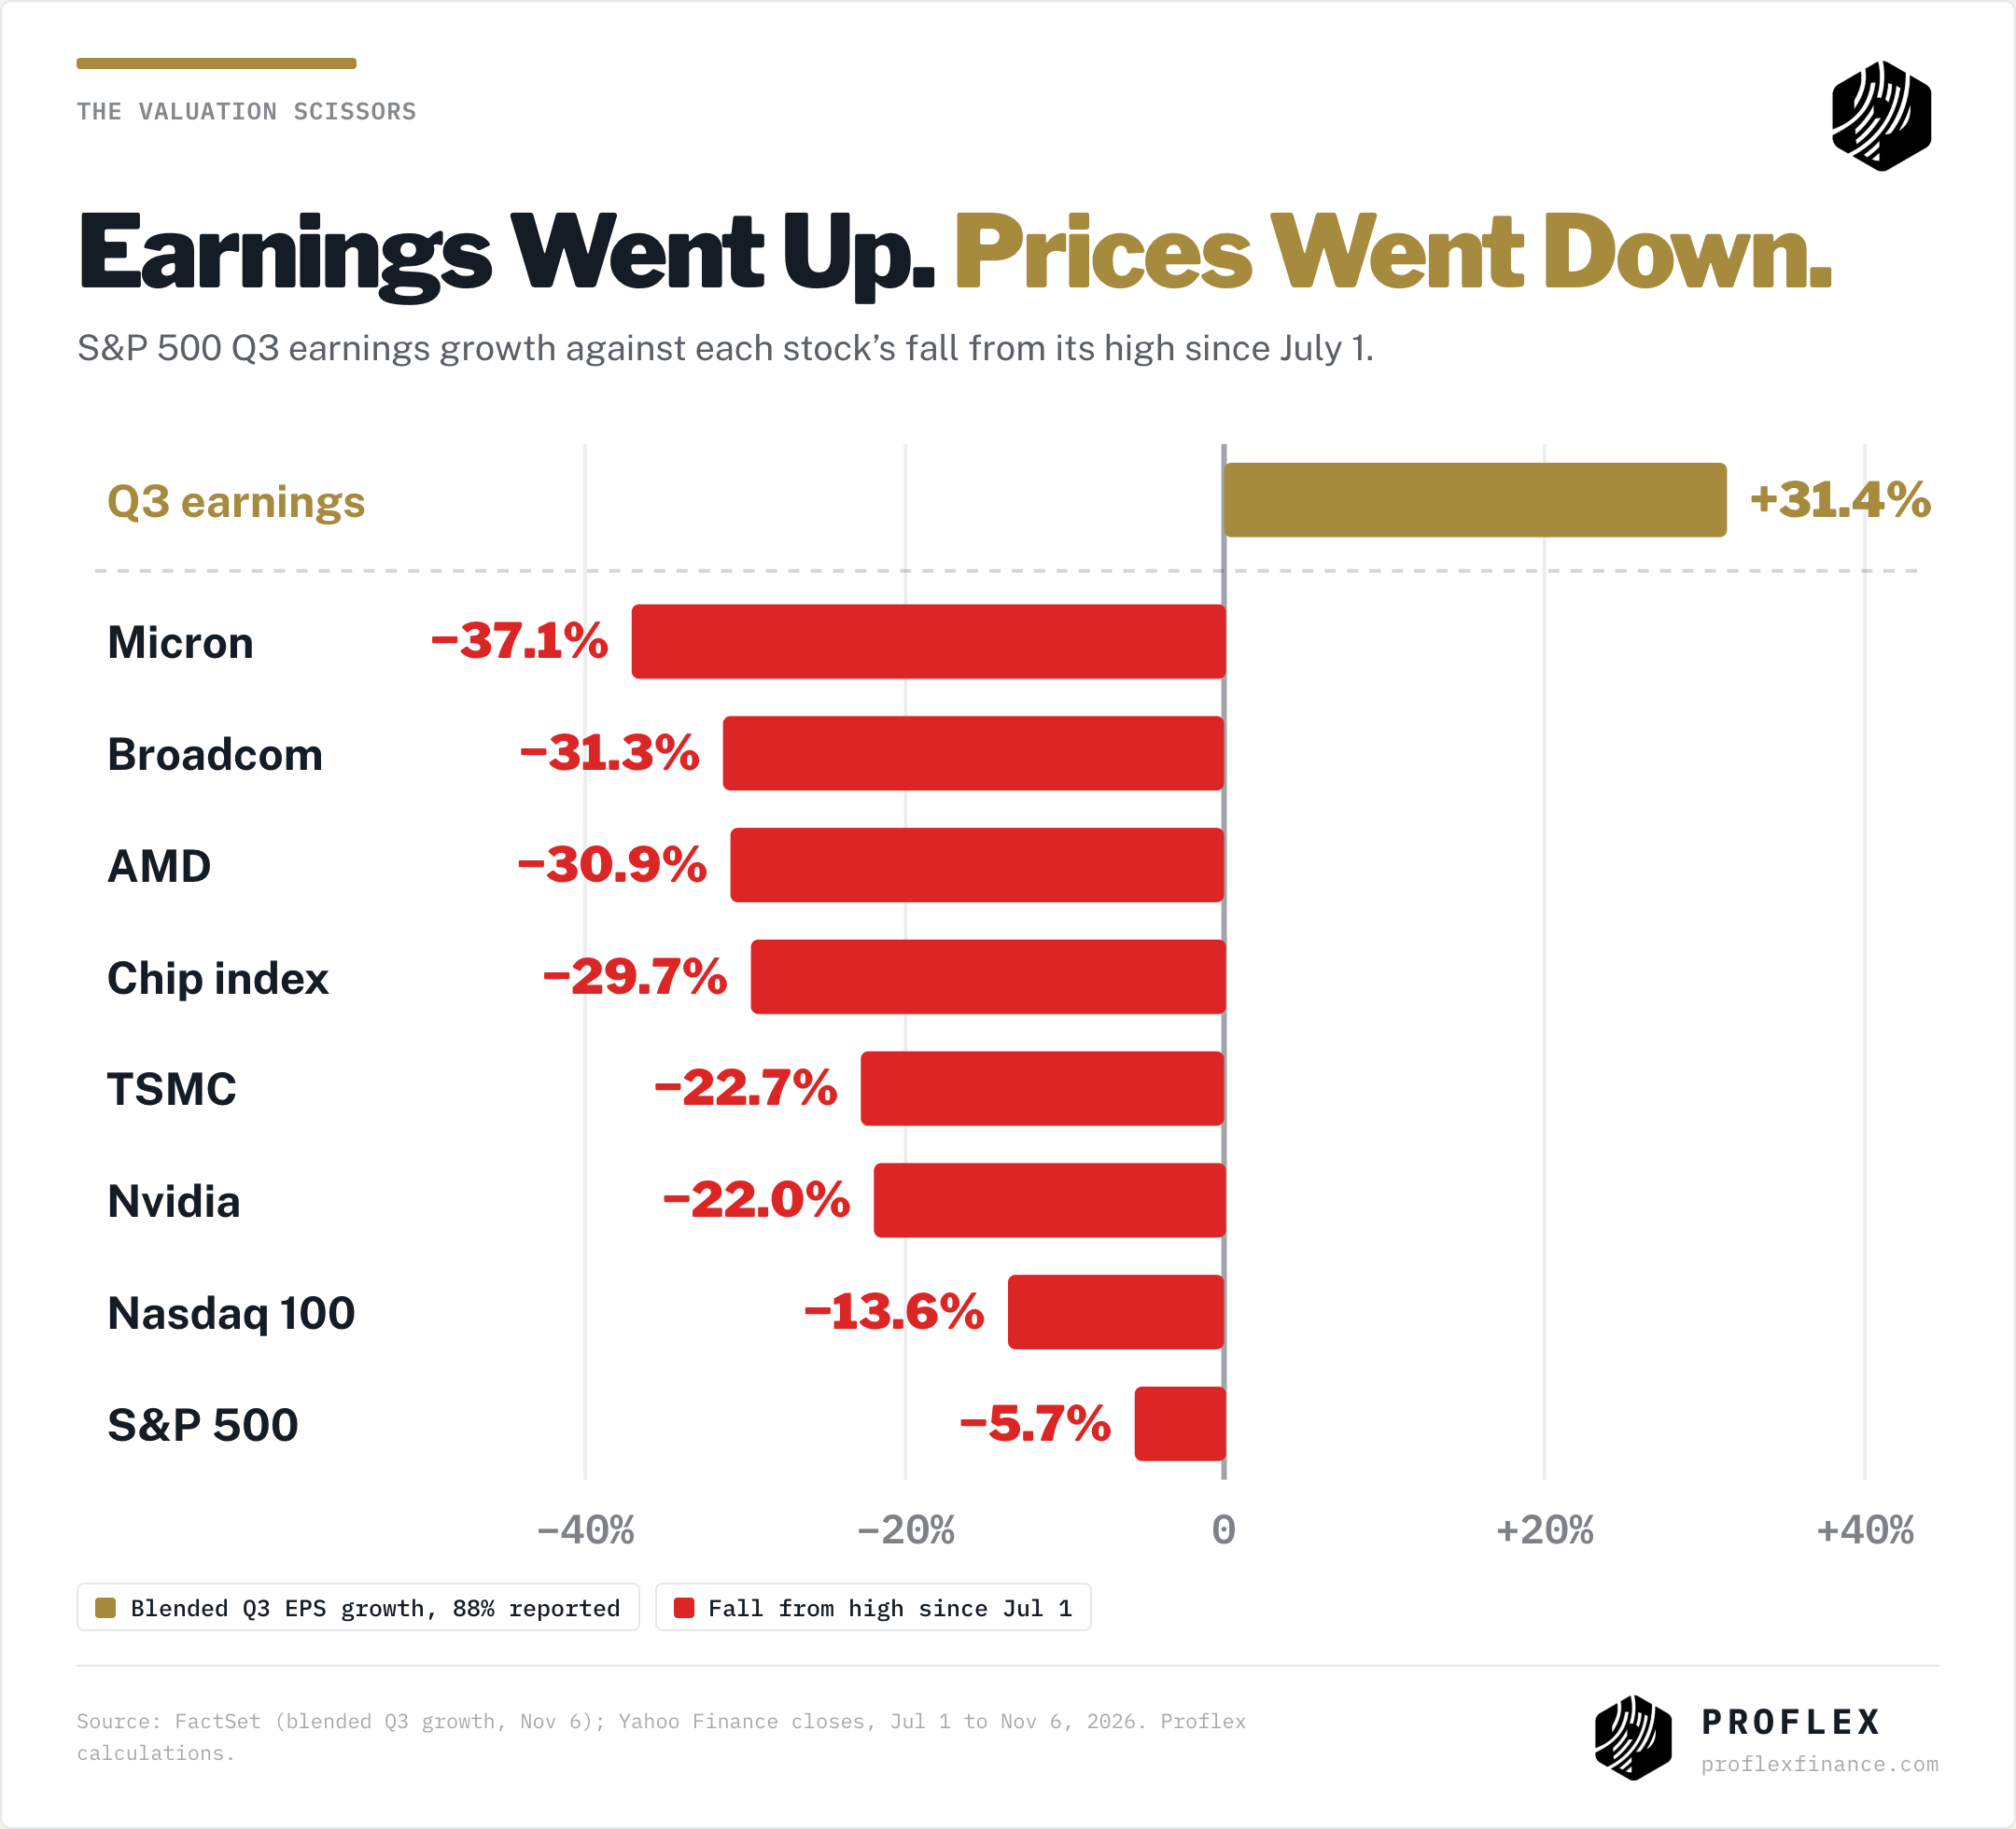
On the numbers, yes. With 88% of the S&P 500 reported, blended third quarter earnings growth is 31.4% (FactSet). Over the same months Micron has fallen 37% from its high, Broadcom and AMD about 31%, and Nvidia 22%. Nvidia now trades near 15 times forward earnings, below Kimberly-Clark at 15.5 times (Koyfin data via Benzinga), after growing revenue 106% to $96.2 billion last quarter. Micron screens at about 4 times forward earnings, the lowest of any large US chipmaker.
Two risks are real and company specific. Micron has paused a planned Taiwan plant over a labour dispute. And over the weekend Nvidia’s board opened an independent investigation after Jensen Huang admitted a personal relationship with a woman US officials suspect of spying for China; the board says it retains confidence in him, and Republican lawmakers want him to testify on November 18 (Bloomberg, CNN). That is headline risk. Nvidia’s results on November 17 are the business test.
Proflex View:In our November 5 All-Access note we called this a margin-call selloff and held every position. Nothing since has changed that read. When the market leaders trade at multiples that price in a bust while earnings grow at 31%, we lean in, slowly. Be cautious with size, never use margin in a tape like this, and add in steps rather than all at once.
What Does the Oil Collapse Mean for Stocks?
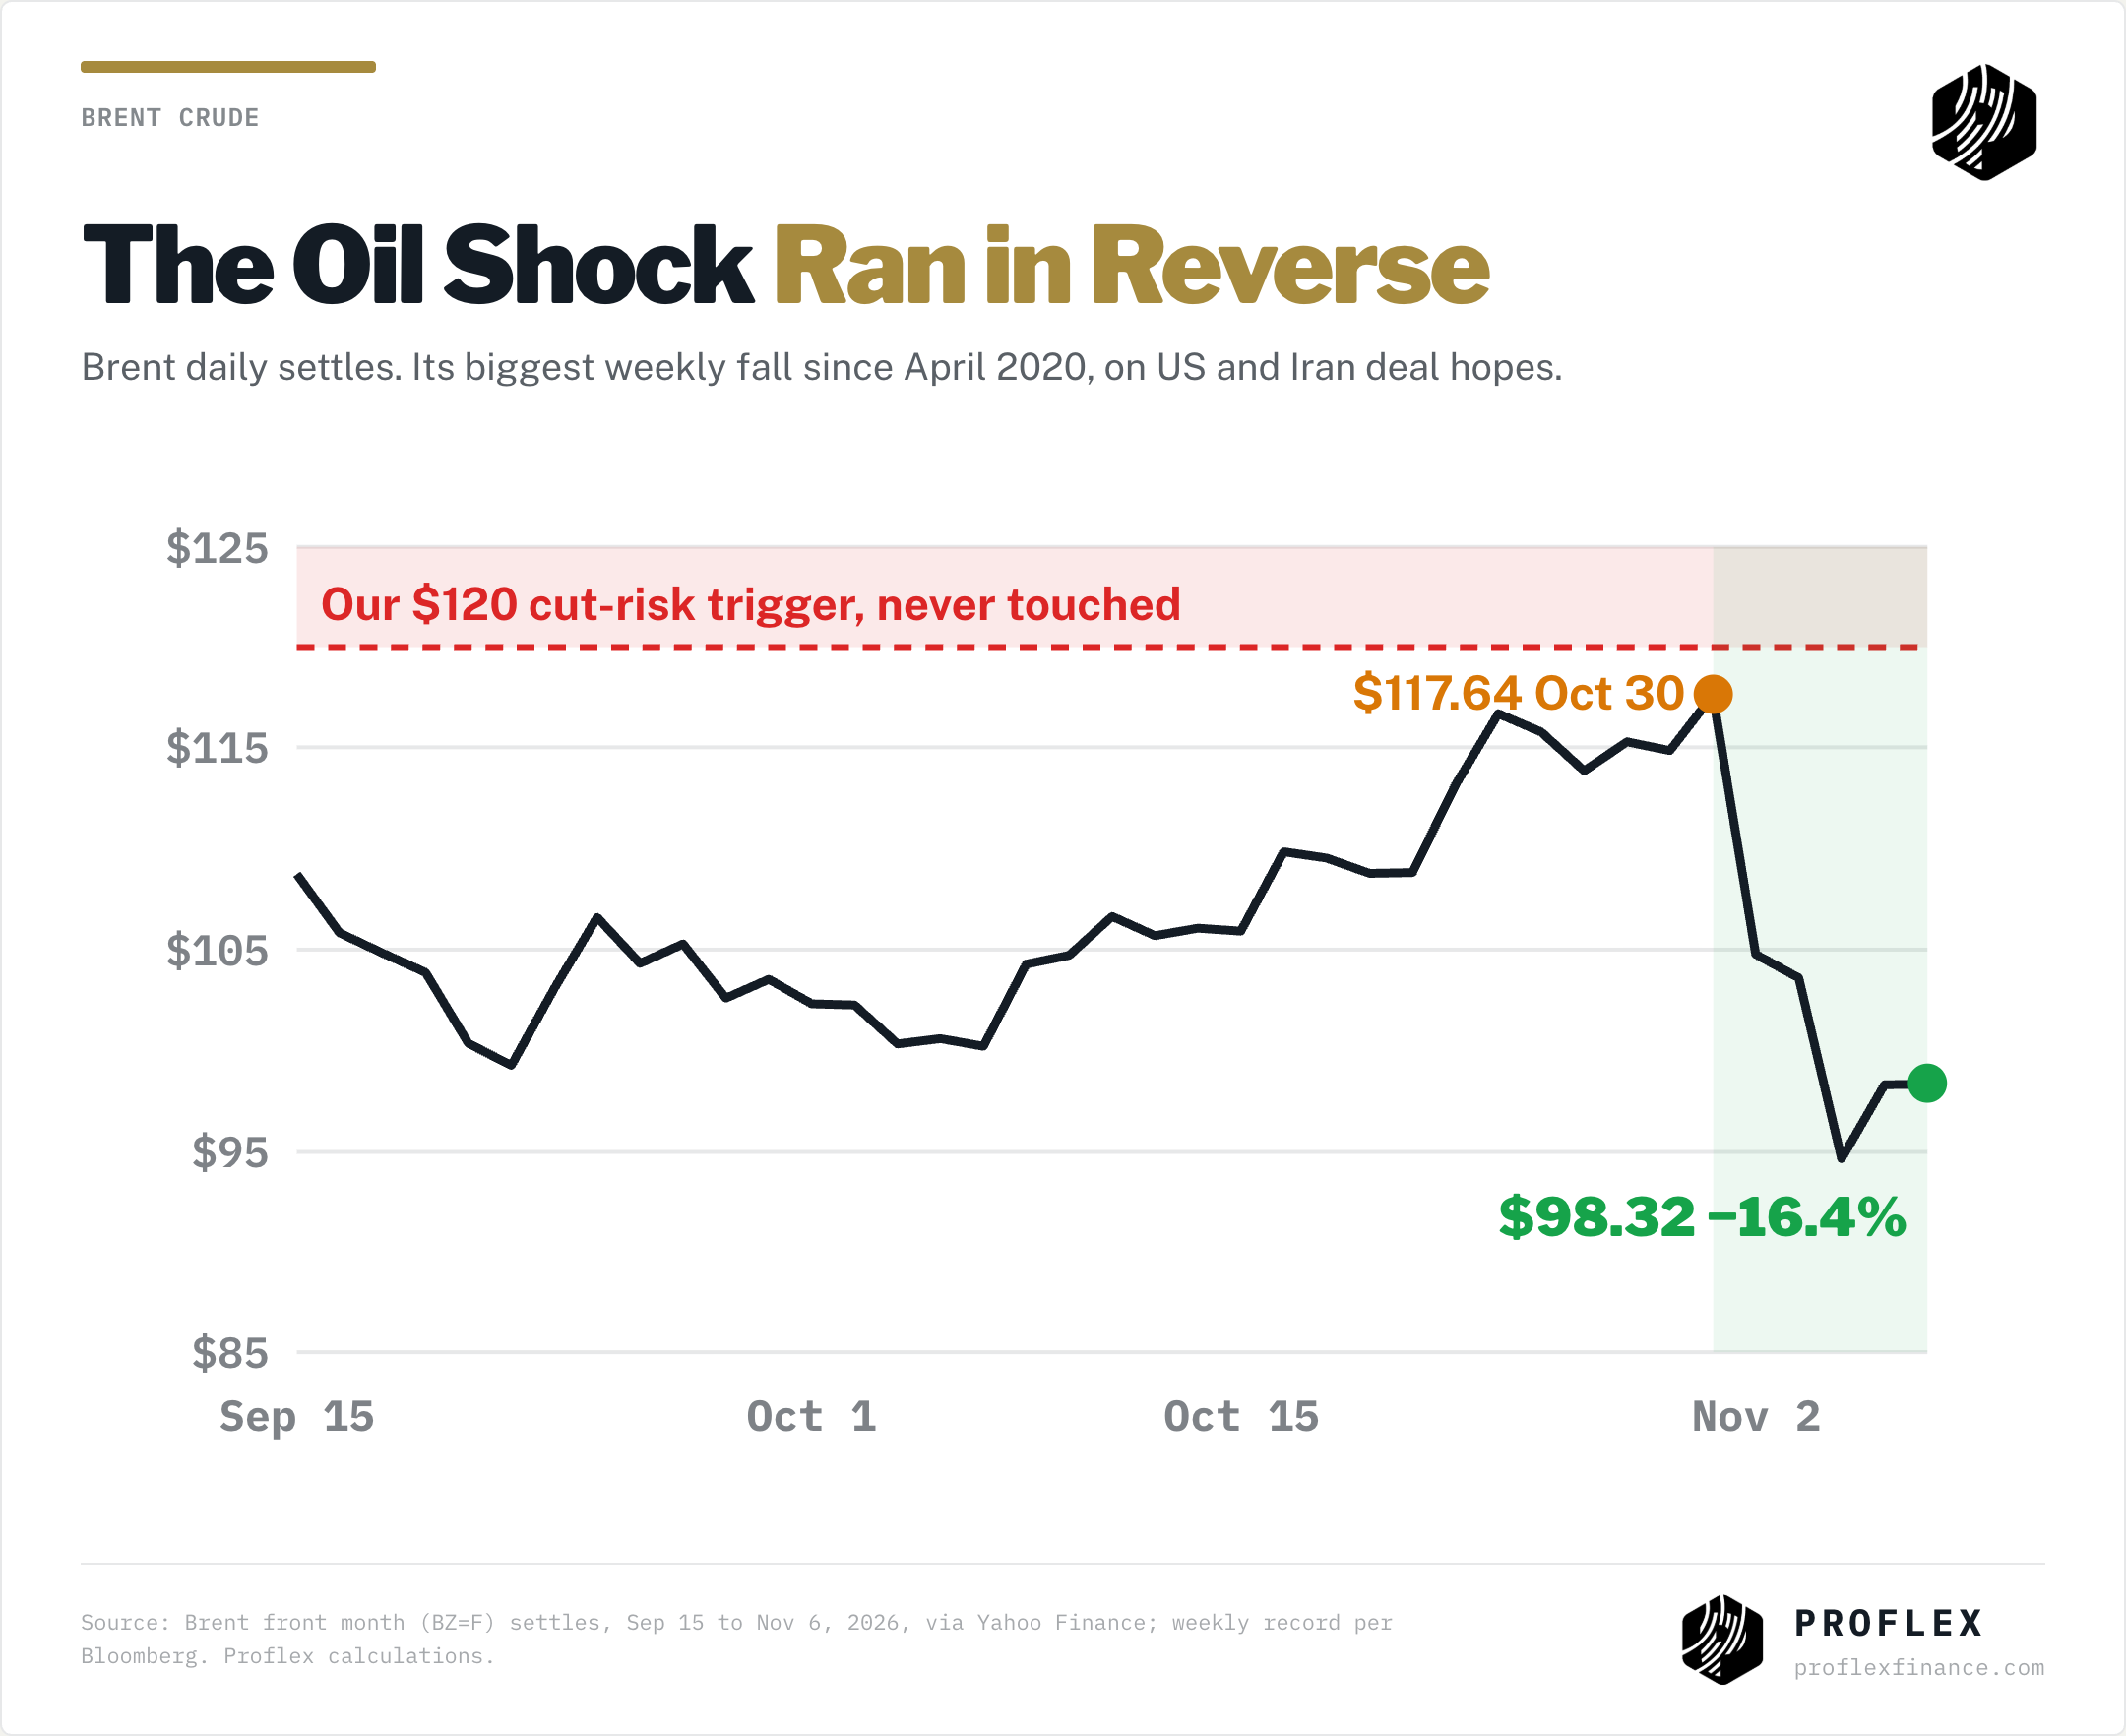
It removes the risk we feared most. Brent fell from $117.64 to $98.32, its biggest weekly fall since April 2020 (Bloomberg), after Iran offered to reopen the Strait of Hormuz within two days and Trump said new strikes were "highly unlikely" if Tehran signs a "very strong agreement." Talks are not settled: Rubio called Iran’s demands unacceptable while Qatar says both sides are still working. Brent traded near $95 on Monday on an unconfirmed report that Iran had eased its Hormuz demands.
Elsewhere the safe havens behaved. Gold rose 4.5% to $4,074.90, so unlike late October it was bought, not sold for cash. Bitcoin slipped 1.9% to about $75,700. The jobs report was strong: payrolls rose 165,000 against roughly 60,000 expected and unemployment fell to 4.1%, which pushed the odds of a December 9 rate hike back up to about 78% (CME FedWatch via Morningstar).
Proflex View:Since mid September we have named Brent at $120 as the trigger for a real correction. Oil never got there, and it is now 18% below that line. The correction came anyway, from leverage. Cheaper oil is the best thing that could happen to Tuesday’s inflation print, and it gives the Fed one less reason to hike.
Our calls, marked honestly ✓ Forced selling, not an earnings collapse (Nov 2): right. Goldman, Nomura and the volume data all say so. ✓ Brent below $110 gives stocks room: right on oil ($98.32), though stocks fell anyway. ✗ The election matters mainly through oil: wrong channel. It hit through AI politics. ✗ Nasdaq 100 against the 28,102 correction line: broken. It closed at 26,989.99. ✗ Bitcoin to reclaim $80,000: briefly ($80,405 on Nov 4), then lost. $75,747 on Friday. ◯ Hold through the margin calls (All-Access, Nov 5): pending. Friday’s rebound is a start, not proof.
Quick Answers
Why did the stock market fall on November 5, 2026? The Nasdaq 100 fell 6.4% and the chip index 12.2% because leveraged ETFs and crowded hedge funds were forced to sell, after the Democratic sweep of Congress revived calls for a data centre moratorium. Junk bonds fell only 0.3%, a sign that the move was driven by leverage rather than a credit scare.
What is a liquidation signature? A liquidation signature is heavy, concentrated selling volume in the most crowded and most leveraged stocks, while the wider market and credit stay calm, followed by a sharp rebound once the forced sellers finish. On November 5 SOXL traded 4.7 times its normal volume and the S&P 500 only 1.4 times.
Which hedge funds lost money in the 2026 AI selloff? Walleye Capital lost 5.9% in October and is restructuring its stock picking unit, Arini is down 32% this year, VARA lost about a third in October, and Marshall Wace, ExodusPoint and Millennium all fell in October. Situational Awareness lost 67% in July.
What happens to stocks after a VIX spike? Since 2007 there have been 32 days when VIX rose more than 40% in one session. The S&P 500 (SPY) was higher one month later on 26 of them, or 81%, with an average gain of 3.12%. VIX rose 69.7% on November 5, 2026, from 16.61 to 28.18.
Are chip stocks cheap after the selloff? As of November 6, 2026, Nvidia traded near 15 times forward earnings and Micron near 4 times, while S&P 500 earnings grew 31.4% in the third quarter. Prices fell 22% to 37% from their highs while earnings rose, which Proflex reads as a valuation reset, not a business collapse.
🔍 What We’re Watching
CPI on Tuesday: consensus +0.3% headline and +0.2% core for the month, with no year on year figure this time. Core at 0.3% or higher firms up a December hike
CoreWeave on Tuesday night: the most leveraged AI name reports right after the liquidation. Its funding comments matter more than its revenue
The Hegseth impeachment vote and any moratorium bill text: hearings are noise, binding law would not be
Iran and Hormuz: Brent near $95. A signed deal takes the last big macro tail risk off the table
Nvidia on November 17 and Huang’s possible testimony on November 18: the real test of whether the AI build out is intact
Our levels: the Nasdaq 100 reclaiming 28,102, the chip index holding above Thursday’s 9,011 close, Bitcoin back above $80,000
Your turn: Reply with the one chip stock you want us to chart against its earnings next week. And if this edition explained the crash better than the headlines did, forward it to one person who sold on Thursday.
🧭 Proflex Playbook – Buy the Forced Sale, Slowly Thursday was a liquidation, not a verdict. Leveraged ETFs, crowded hedge funds and Korean margin books sold what they had to, and the chip leaders now trade at multiples that price in a bust while earnings grow at 31%. Credit held, gold was bought and oil fell 16%. Add to the cash generative leaders in steps, never with borrowed money, and let CPI on Tuesday and Nvidia on November 17 set the pace. Our conviction stays anchored in the data:
Focus on Structural Growth: Continue to overweight the secular AI theme, recognizing its multi-year runway.
Anticipate Shallow Corrections: Use dips as accumulation opportunities, not reasons for fear, understanding that "none of the corrections stick."
Diversify Thoughtfully: Recognize the "decorrelation" across asset classes; consider gold, silver and Bitcoin for portfolio resilience.
Develop Mental Models: Prioritize long-term planning (6-12 months out) over short-term news, aiming for consistent, incremental gains.
If you're an All-Access or Managed Portfolio subscriber, our positioning has already shifted ahead of this moment—scaling up asymmetric hard asset plays while hedging for earnings volatility and geopolitical tail risks.
Proflex All-Access: Your Market Compass
Explore the financial markets with Proflex All-Access, your comprehensive resource for deeper market understanding and active participation. This premium service offers subscribers exclusive insights and actionable investment advice, giving you a significant edge in various market conditions.
Proflex All-Access provides detailed analyses and recommendations to optimize your investment strategy. Our specialized newsletters include:
• Growth Gazette (Contains Crypto Pulse) : Aimed at achieving above-market returns for aggressive portfolio growth.
• Income Insider: Focused on conservative strategies and income generation for yield-seeking investors.
Until next week, — The Proflex Team Trusted Macro Insights. Calm Investing. Tactical Trades.
Elevate your financial IQ
ProFlex® by Blockstart Research Legal Disclosures
ProFlex® by Blockstart Research, the premium newsletter product series, provides informational and educational content only and does not offer personalized investment advice or establish a fiduciary relationship. While we rely on reliable sources and research, the information is not tailored to individual financial situations. Readers are urged to consult qualified financial professionals before making investment decisions. We do not guarantee the accuracy, completeness, or timeliness of the information and are not responsible for any investment decisions based on this newsletter. Investing carries risks, and past performance doesn't predict future results. By accessing this newsletter, you acknowledge that we are not liable for actions or decisions resulting from its content. Please conduct due diligence and seek professional advice as needed.
Proflex Institutional Research Series
Elevate Your Investment Game!
ProFlex® is designed to optimize your time, ignite your investment IQ, and maximize your financial potential.